Visualising Traffic Accidents and Casualties in the United Kingdom (2009 - 2016)
A visualisation of reported accidents and resulting casualties (fatal and non-fatal) in the UK for the period 2009 - 2016 using data
obtained from the Department for Transport, Road Safety website.
Each accident is represented as a marker on the map with a popup to show when, where, how the accident occurred and who and what were involved. To avoid having a crowded display of markers as there is a large number of accidents, over 150,000 per year, the markers are presented as clusters and heatmap.
Usage instruction:
After the map loads, select a year, select display by cluster and heatmap in whichever order.
Before selecting another year to view clusters and heatmap, select Home.
Depending on the speed of your computer the displays will take approximately 30 seconds to appear.
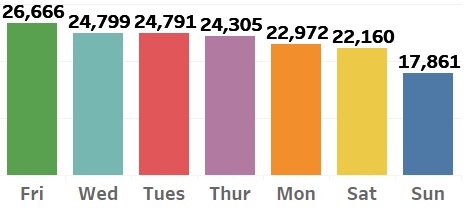
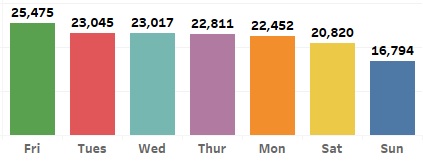
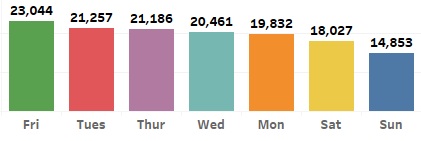
Total number of accidents for 2009 - 2016

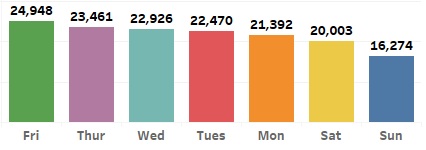
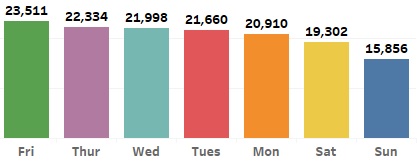
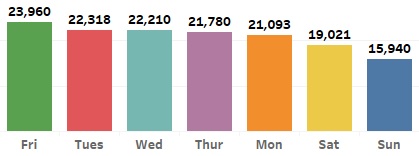
Total number of casualties for 2009 - 2016

Each accident is represented as a marker on the map with a popup to show when, where, how the accident occurred and who and what were involved. To avoid having a crowded display of markers as there is a large number of accidents, over 150,000 per year, the markers are presented as clusters and heatmap.
Usage instruction:
After the map loads, select a year, select display by cluster and heatmap in whichever order.
Before selecting another year to view clusters and heatmap, select Home.
Depending on the speed of your computer the displays will take approximately 30 seconds to appear.
Total number of accidents for 2009 - 2016

Total number of casualties for 2009 - 2016

